Mastering the Multiple Round Chart for Presentations That Actually Work
You have probably stared at a slide filled with numbers and felt your audience's attention drifting away. It happens to the best of us. A Multiple Round Chart can solve that problem beautifully, but only if you use it with intention. This type of chart turns dry data points into visual stories that viewers grasp almost instantly. The challenge is that many people treat it like a decoration rather than a communication tool, and that is where things go sideways.
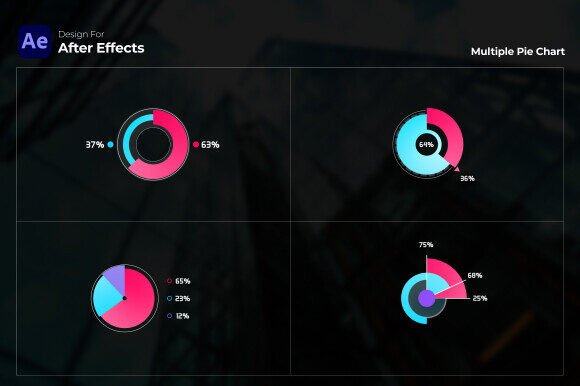
What makes a multiple round chart different from a standard pie or donut chart is its layered structure. Instead of cramming everything into one circle, you distribute information across several rounded segments or rings. This lets you compare categories, show progression, or highlight relationships without overwhelming the eye. When paired with gradient styling, the chart gains depth that flat colors simply cannot match. But before you drag and drop your data, there are a few practical points worth understanding.
Why People Gravitate Toward Multiple Round Charts
The appeal is straightforward. Humans process visual patterns faster than text. A well-designed multiple round chart organizes complexity into digestible chunks. Business reports benefit because executives can scan quarterly performance at a glance. Educators use them to break down survey results or scientific data for students who might otherwise tune out. Marketers rely on them to present campaign metrics without burying stakeholders in spreadsheets.
However, interest alone does not guarantee good results. The real value comes from understanding what the chart format can and cannot do. Too often, users pick a template based on looks and force their data into a shape that does not fit. The outcome is confusion rather than clarity. Recognizing this early saves time and embarrassment.
Overlooking Data Compatibility Before You Start
One of the most common mistakes is assuming every dataset belongs in a circular format. A multiple round chart works best when you need to show proportional relationships or compare a few key categories across different segments. If your data includes more than six or seven major divisions per ring, the chart becomes cluttered and unreadable. The same applies when values are nearly identical. Viewers cannot distinguish thin slices from one another, which defeats the purpose.
Imagine a marketing manager preparing a presentation on customer acquisition channels. They want to display organic search, paid ads, social media, email, referrals, and direct traffic across three different quarters. This is a perfect use case because the categories are limited and the comparison over time adds insight. Now contrast that with someone trying to chart twenty product subcategories across five regions. That information belongs in a bar chart or a well-organized table, not a round infographic.
Before opening any After Effects template or design tool, ask yourself whether the audience needs to see parts of a whole or trends over time. If the answer is both, a multiple round chart with distinct rings for each time period can work well. If the main point is absolute values rather than proportions, consider a different visual approach entirely.
Misusing Automatic Value Calculation Features
Templates that offer auto value calculation are convenient, but they can create a false sense of security. You input raw numbers, and the chart updates instantly. The risk is forgetting to verify what the template is actually displaying. Some tools calculate percentages based on the total of all values entered, while others treat each ring independently. Mixing these methods without realizing it leads to misleading visuals.
Here is a realistic example. A freelancer preparing a client report enters revenue figures for three service lines across four quarters. They assume the template is showing each quarter's proportional breakdown. In reality, the template is comparing each ring's absolute totals against one another, making a growing quarter look disproportionately large next to a slower one. The client misreads the chart and questions the data's accuracy. A quick check of the calculation logic would have prevented the confusion.
The fix is simple. After inputting data, manually verify at least two data points against your source material. Compare the visual proportions to your expected ratios. If something looks off, investigate the settings. Most professional templates, including those built for After Effects CC 2023 and above, give you control over how values are interpreted. Use that flexibility rather than accepting defaults blindly.
Ignoring Color Choices and Gradient Consistency
Gradient styling elevates a chart from basic to polished, but only with thoughtful application. A common error is selecting gradients that look beautiful in isolation but clash when placed next to each other in adjacent rings or segments. The result is visual noise that distracts from the data. Another pitfall is using gradients with insufficient contrast between adjacent slices. Viewers with color vision deficiencies may not distinguish the boundaries at all.
Good practice involves testing your palette in grayscale before finalizing anything. If the chart remains legible without color, your contrast choices are solid. When using a Multiple Gradient Round Chart template, take advantage of the customization options to adjust hue, saturation, and brightness per ring. Keep the light source consistent across all gradients to maintain a cohesive look. There is no rule against vibrant colors, but they should serve the message rather than compete with it.
Consider an educational video explaining demographic shifts across decades. Using a warm-to-cool gradient progression that moves from one ring to the next subtly reinforces the passage of time. This kind of intentional design choice makes the data more memorable without adding clutter. It also demonstrates professionalism that audiences appreciate, even if they cannot articulate why the chart feels satisfying to view.
Skipping the Audience Perspective Test
Designers and content creators often become so familiar with their own data that they assume clarity where none exists. A multiple round chart that seems perfectly obvious to you may confuse someone encountering it for the first time. Without legends, clear labels, and logical ring ordering, viewers spend mental energy decoding the graphic instead of absorbing the insights.
A practical habit is to show a draft to someone unfamiliar with the project. Watch where their eyes go first. Ask them what they think the chart is communicating. If they hesitate or misinterpret the main point, revise the labeling and structure. This step takes minutes but can transform a mediocre presentation into a compelling one. The best templates, including those designed for Full HD 1920×1080 resolution, give you enough control to adjust text placement and legend positioning without compromising the design.
What to Check Before Using Any Round Chart Template
Not all templates are created equal. Some require third-party plugins that complicate your workflow or introduce compatibility issues. Others lock certain elements, leaving you stuck with a font that does not match your brand or a color that clashes with your presentation deck. Reading the technical details carefully avoids frustration later.
Look for templates that are fully customizable and clearly state their compatibility. The mention of no plugins required is a practical indicator that you can open the file and start working immediately. Similarly, knowing that free font links are provided means you will not encounter missing typeface errors upon opening the project. These details might seem minor during the selection process, but they directly affect how smoothly your production goes, especially under tight deadlines.
Resolution matters too. A template built for Full HD ensures your charts look crisp on modern displays and projectors. Anything lower can appear soft when scaled up during a presentation. Additionally, confirm that the template supports the specific After Effects version you are running. Compatibility with CC 2023 and above covers most current users, but double-checking your own software version before purchase prevents compatibility headaches.
Making the Most of Multi-Round Chart Designs
Once you have selected a suitable template and verified your data fits the format, think about narrative flow. A multiple round chart should tell a story. Start with the outermost ring or the most prominent segment and guide the viewer inward or outward in a logical sequence. Use animation features judiciously. A subtle reveal of each ring builds anticipation and lets you explain findings step by step. Overly flashy transitions, on the other hand, cheapen the content and test patience.
Business reports benefit from restraint. Let the gradient styling provide elegance while keeping motion minimal. Educational content can afford more dynamic animations because the goal is engagement and retention. Match the energy of the chart to the context of its use. This is where templates that are described as user-friendly truly shine. Beginners can achieve professional results without wrestling with complex keyframe adjustments, while experienced motion designers can still dive deep into customization when needed.
Annual and quarterly reports often contain dense information that stakeholders need to reference repeatedly. A well-crafted multiple round chart in these documents serves as both a summary and a visual anchor. Stakeholders remember the graphic and associate it with the conclusions you want to emphasize. That is a powerful communication advantage that static tables simply cannot replicate.
Building Better Data Stories Without the Guesswork
The difference between an effective multiple round chart and a confusing one often comes down to preparation. Spend time cleaning your data before you begin. Remove outliers that skew proportions. Group minor categories into an "other" segment to maintain readability. Decide what you want the audience to conclude, and structure the chart to lead them there. These steps require no technical skill, only discipline.
When evaluating templates, prioritize those that give you control over every element. The ability to adjust colors, fonts, ring thickness, and value calculation methods ensures the final result aligns with your specific needs. A template that looks stunning in a preview video may still require tweaks to match your brand guidelines. Flexibility makes those adjustments possible without starting from scratch.
Finally, remember that a multiple round chart is a tool, not a solution by itself. It amplifies good data and clear thinking. It cannot rescue flawed analysis or compensate for missing context. Treat it as the final polish on a well-prepared presentation, and your audience will recognize the quality. Ignore this principle, and even the most beautiful gradient styling will feel hollow.
Take the time to learn the tool properly. Experiment with sample data before committing to your actual project. Explore how different ring arrangements affect perception. The investment in understanding pays off every time you present, whether to a boardroom, a classroom, or a global online audience. Your data deserves the clarity that a thoughtfully used multiple round chart provides.